
Finnvera's year 2025
Welcome to Finnvera Group’s Annual Report 2025. On this page you will find a summary of the year’s highlights, key figures and our PDF reports.
PDF publications
Key figures
Financing granted
LOANS AND GUARANTEES GRANTED
1.0 bn EUR
(0.9)
EXPORT CREDIT GUARANTEES, EXPORT GUARANTEES AND SPECIAL GUARANTEES GRANTED
7.0 bn EUR
(2.9)
EXPORT CREDITS (EUR 3.1 bn OF WHICH FELL THROUGH DURING THE YEAR)
5.6 bn EUR
(0.6)
Clients in 2025
NUMBER OF CLIENTS AT YEAR END
19,300
(21,100)
THE SHARE OF GUARANTEES OF THE DOMESTIC FINANCING
81%
CLIENTS WILLINGNESS TO RECOMMEND FINNVERA (NPS)
78 points
(78)
Finnvera Group
RESULT
16 MEUR
(228)
RESULT BEFORE THE RETURN OF FUND PAYMENT COMMITMENT
365 MEUR
(228)
BALANCE SHEET TOTAL
15.5 bn EUR
(14.8)
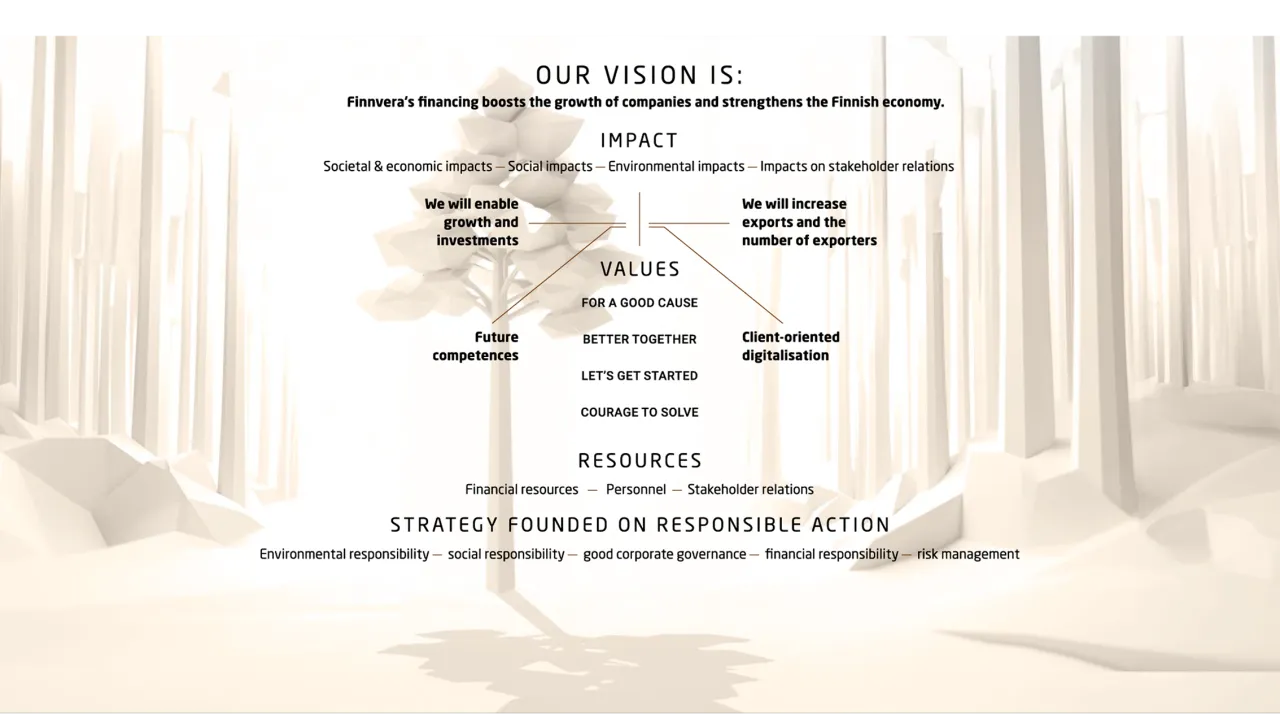
This is how Finnvera creates value
Share page: